Kerala PSC Previous Years Question Paper & Answer
Page:2
Below are the scanned copy of Kerala Public Service Commission (KPSC) Question Paper with answer keys of Exam Name 'Research Officer - Economics and Statistics ' And exam conducted in the year 2021. And Question paper code was '123/2021'. Medium of question paper was in Malayalam or English . Booklet Alphacode was 'A'. Answer keys are given at the bottom, but we suggest you to try answering the questions yourself and compare the key along wih to check your performance. Because we would like you to do and practice by yourself.
10.
11.
12.
13.
14.
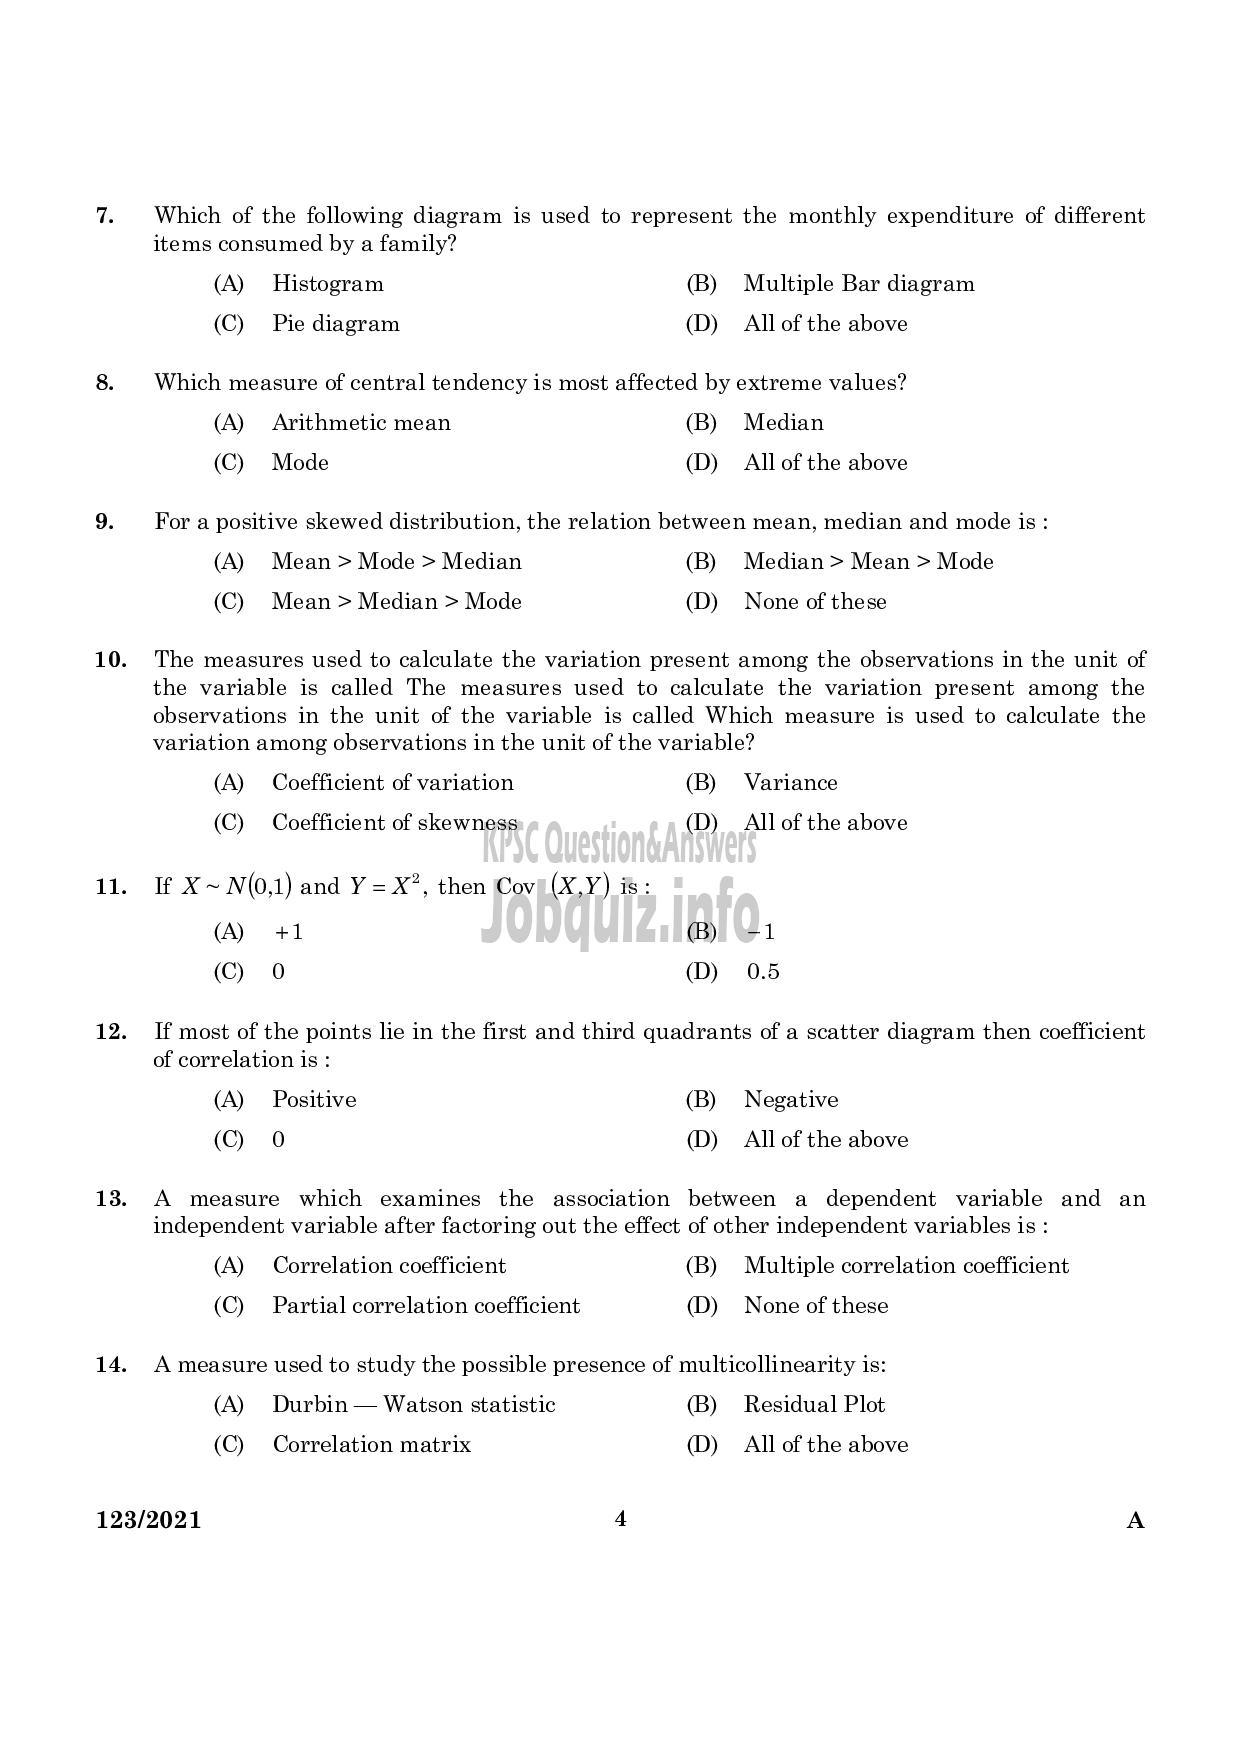
Which of the following diagram is used to represent the monthly expenditure of different
items consumed by a family?
(^) Histogram (B) Multiple Bar diagram
(C) Pie diagram (D) Allof the above
Which measure of central tendency is most affected by extreme values?
(A) Arithmetic mean (B) Median
(C) Mode (D) Allof the above
For a positive skewed distribution, the relation between mean, median and mode is :
(A) Mean > Mode > Median (B) Median > Mean > Mode
(C) Mean > Median > Mode (D) None of these
The measures used to calculate the variation present among the observations in the unit of
the variable is called The measures used to calculate the variation present among the
observations in the unit of the variable is called Which measure is used to calculate the
variation among observations in the unit of the variable?
(A) Coefficient of variation (B) Variance
(C) Coefficient of skewness (D) All of the above
If X~ N(0,1) and ए = 22, then Cov (X,Y) is:
(A) +1 ൯ -1
(0 0 (0) 0.5
If most of the points lie in the first and third quadrants of a scatter diagram then coefficient
of correlation is :
(A) Positive (B) Negative
(C) 0 ൯) 21 വ് the above
A measure which examines the association between a dependent variable and an
independent variable after factoring out the effect of other independent variables is :
(ಸಿ) Correlation coefficient (B) Multiple correlation coefficient
(C) Partial correlation coefficient (D) None of these
A measure used to study the possible presence of multicollinearity is:
(A) Durbin — Watson statistic ൯) Residual Plot
(C) Correlation matrix ൯) All of the above
123/2021 4 A
